All about what the effort index is, and its advantages
The following article introduces the concept of the Effort Index and its relationship with the loss of speed in the series and the character of the effort.
In this series of articles we deal with some of the most important concepts of strength training, collecting notes from the recently published book Strength, Speed and Physical and Sports Performance written by renowned researchers Juan José González Badillo and Juan Ribas Serna.
SUMMARY
- Given the same relative intensity and the same loss of speed in the series, fatigue is also similar, although the number of repetitions performed in the series by each subject is different.
- The effort index is the result of multiplying the velocity of each percentage of the RM by the value of the loss of velocity in the series or set of series.
- The effort index has a much higher predictive value than any other variable to estimate the loss of speed with a load of 1 m·s-¹, that is, to estimate the degree of effort.
- Only if the effort rates are equalized can it be ensured that the relative intensity is the independent variable of the training.
- Average ranges of the Effort index between 7.5 and 14.8 for the squat exercise with an intensity of 70 to 85% offer better results than values higher than 22.1.
On the one hand, it has been observed that when training with loads with which a maximum number of repetitions in the series can be done between ~12 and ~4, and efforts are made that go from 50% of the possible repetitions to the maximum possible repetitions (XRM or nRM), there is a close relationship between the loss of speed in the series and the fatigue generated. Fatigue was estimated by the loss of speed before a load that could be moved at 1 m*s-1 and by the loss of jump height.
The relationship between these variables when dealing individually with each of the loads studied is almost perfect. But, in addition, in this case, when they were all considered together, the ratios were also very high. That means that when it comes to determining the intensity through the maximum number of repetitions possible in the series (between 12 and 4 repetitions maximum, in this case), lthe loss of speed in the series, or the number of repetitions performed in the set, remarkably accurately estimates the fatigue generated in the set.
 However, in this case, two issues should be taken into account:
i) when training with these loads, not all subjects did so with the same relative intensity, since, as has been seen, performing the same maximum repetitions in the series does not represent the same relative intensity for all subjects, and
ii) A certain number of repetitions were performed with respect to the maximum possible, starting with at least half of the possible repetitions, so we do not know what happens when less than half of the possible repetitions are done in the series, load, which seems to be very important in training.
Therefore, the relative intensity was not the same for all subjects, the loss of speed in the series was not determined before the effort was made, but was measured afterwards, the efforts were always made with at least half of the possible repetitions in the series.
On the other hand, when starting from the same relative intensity, it has been verified that with the same loss of speed in the series, the percentage of repetitions performed in the series is similar, which allows us to admit that Faced with the same relative intensity and the same loss of speed in the series, fatigue is also similar, although the number of repetitions performed in the series by each subject is different..
Faced with the same relative intensity and the same loss of speed in the series, fatigue is also similar, although the number of repetitions performed in the series by each subject is different.
According to what has been exposed, given the same relative intensity, whether it is estimated by the maximum number of repetitions that can be done in a series, or by the speed of the first repetition in the series, the loss of speed in the series is a good estimator of the degree of effort made. However, we still do not have a solution to all possible situations that arise. On the one hand, because taking an XRM as a reference is not appropriate, for the multiple reasons that we have explained in chapter 4, and secondly because we have not contrasted the degree of effort generated at different relative intensities when these are determined by the speed of the first repetition.
In previous articles it has been shown that the definition and quantification of the character of the effort or degree of effort is expressed in the most complete and precise way by the value of the speed of the first repetition and by the value of the loss of speed in the series. If you start from the same speed in the first repetition, that is, from the same relative intensity, this variable is already controlled, so the only thing that remains to be checked is whether the loss of speed in the series correctly expresses the degree of effort. This has been amply verified through the studies commented in the previous sections. But it remains to be verified if, in fact, these two variables are valid when calculating the degree of effort generated with the combination of different relative intensities and different speed losses in the series.
the loss of speed in the series is a good estimator of the degree of effort expended
To address this problem, a study has been carried out, partially published (Rodríguez-Rosell et al., 2018), in which the loss of speed with a load of 1 m s has been analyzed.–¹ (fatigue) and the jump loss (fatigue) produced in 16 efforts, consisting of four speed losses after three series with the maximum load of the day at four relative intensities. In the bench press the four speed losses with respect to the speed of the first repetition were: 15, 25, 40 and 55%, and in the squat: 10, 20, 30 and 45%. The four relative intensities for both exercises were: 50, 60, 70, and 80% of 1RM. Table 1 presents the scheme of the study.
squat
| Relative intensity determined by speed | Series (first number) with each loss of speed (percentages). Between parentheses, the number and order in which the efforts were made (e) | |||
| ~1.13 m·s–¹ (50% 1RM) | 3 x 10% (E1) | 3 x 20% (E3) | 3 x 30% (E2) | 3 x 45% (E4) |
| ~0.98 m·s–¹ (60% 1RM) | 3 x 10% (E5) | 3 x 20% (E7) | 3 x 30% (E6) | 3 x 45% (E8) |
| ~0.82 m·s–¹ (70% 1RM) | 3 x 10% (E9) | 3 x 20% (E11) | 3 x 30% (E10) | 3 x 45% (E12) |
| ~0.68 m·s–¹ (80% 1RM) | 3 x 10% (E13) | 3 x 20% (E15) | 3 x 30% (E14) | 3 x 45% (E16) |
bench press
| Relative intensity determined by speed | Series (first number) with each loss of speed (percentages). Between parentheses, the number and order in which the efforts were made (e) | |||
| ~0.95 m·s–¹ (50% 1RM) | 3 x 15% (E1) | 3 x 25% (E3) | 3 x 40% (E2) | 3 x 55% (E4) |
| ~0.79 m·s–¹ (60% 1RM) | 3 x 15% (E5) | 3 x 25% (E7) | 3 x 40% (E6) | 3 x 55% (E8) |
| ~0.62 m·s–¹ (70% 1RM) | 3 x 15% (E9) | 3 x 25% (E11) | 3 x 40% (E10) | 3 x 55% (E12) |
| ~0.47 m·s–¹ (80% 1RM) | 3 x 15% (E13) | 3 x 25% (E15) | 3 x 40% (E14) | 3 x 55% (E16) |
Tabla 1. Diagram of the efforts made with the squat and bench press exercises, with four relative intensities and four speed losses in each exercise (Rodríguez-Rosell et al., 2018).
Figure 1 shows an example of the protocol followed to carry out each of the efforts. In each session, during the warm-up phase, the load that the subject was capable of displacing at ~1 m s-1 was measured.¹ (the three initial dark bars in the figure), the subject continued to warm up until reaching the load with which the expected effort for the session had to be made, performing the three series at the maximum speed possible to reach the expected loss of speed in each series (the three sets of lighter bars in the center of the image).
Immediately after doing the last repetition of the third series, the speed with the load that had previously moved ~1 m s-¹ (dark bars on the right of the image) was measured again and a blood sample was taken. to measure lactate concentration. When it came to the squat exercise, before warming up with loads, a specific warm-up was done for the vertical jump and it was measured, and at the end of the last repetition of the training session it was measured again.
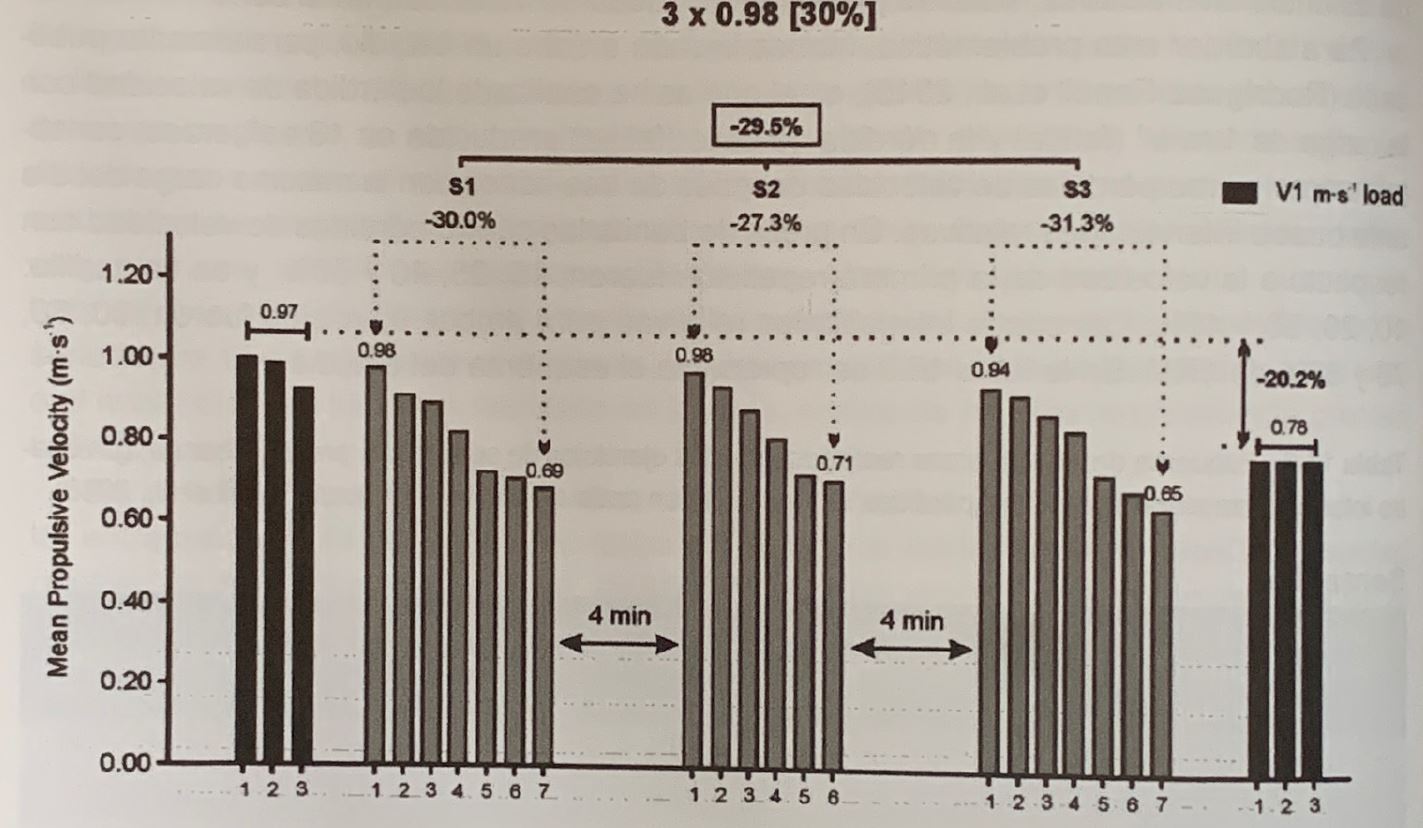
Figure 1. Real example of an effort protocol of a subject in the squat exercise with the load equivalent to 60% of the RM (0.98 ~1 m s–¹ of speed in the first repetition of the first series) and a 30% loss of speed in each series. Recovery time between sets was 4 minutes. The average speed loss in the three series was 29.5%, and the speed loss with the 1 m·s–¹ load after effort was 20.2%. The subject performed 7, 6 and 7 repetitions in the first, second and third series, respectively, until losing the programmed speed. (Rodríguez-Rosell et al., 2018).
Table 2 shows the speed losses with the load of 1 m·s–¹ and the lactate concentration after the 16 efforts with each of the exercises. Within each exercise, there is a clear tendency to lose more speed (more fatigue) and to reach greater lactate contraction than more speed is lost in the series at the same relative intensity, but the values of these two variables decrease as the relative intensity increases. Although the differences between the exercises in the variables of velocity loss and lactate concentration are indicated at the foot of the table, it must be taken into account that these data have been produced with different values of velocity loss in the series in both exercises.
| SQ | BP | ||||
| REP | Loss of MPV with V1 m·s–¹ load (%) | Lactate (mmol.L–¹ | REP | Loss of MPV with V1 m·s–¹ load (%) | Lactate (mmol*L–¹) |
| 50% 1RM_10% VL | 14.0 ± 7.7 | 3.5 ± 1.9 | 50% 1RM_15% VL | 14.0 ± 5.3 | 2.6 ± 0.5 |
| 50% 1RM_20% VL | 16.0 ± 7.2 | 6.7 ± 2.8 | 50% 1RM_25% VL | 20.5 ± 5.0 | 3.3 ± 0.9 |
| 50% 1RM_30% VL | 25.1 ± 8.2 | 8.3 ± 3.1 | 50% 1RM_40% VL | 37.7 ± 9.9 | 4.5 ± 1.1 |
| 50% 1RM_45% VL | 31.5 ± 8.5 | 9.7 ± 2.7 | 50% 1RM_55% VL | 46.0 ± 11.7 | 5.4 ± 0.9 |
| 60% 1RM_10% VL | 14.4 ± 5.1 | 3.9 ± 1.6 | 60% 1RM_15% VL | 13.1 ± 5.5 | 2.6 ± 0.4 |
| 60% 1RM_20% VL | 15.9 ± 6.7 | 4.6 ± 1.7 | 60% 1RM_25% VL | 18.5 ± 5.9 | 3.1 ± 0.5 |
| 60% 1RM_30% VL | 20.4 ± 6.9 | 5.2 ± 2.1 | 60% 1RM_40% VL | 24.1 ± 7.4 | 4.0 ± 0.7 |
| 60% 1RM_45% VL | 24.0 ± 10.1 | 7.5 ± 2.0 | 60% 1RM_55% VL | 37.1 ± 12.3 | 4.6 ± 0.9 |
| 70% 1RM_10% VL | 10.2 ± 5.9 | 2.9 ± 0.9 | 70% 1RM_15% VL | 12.3 ± 4.0 | 2.6 ± 0.4 |
| 70% 1RM_20% VL | 14.9 ± 7.5 | 4.2 ± 1.5 | 70% 1RM_25% VL | 18.2 ± 7.2 | 2.9 ± 0.4 |
| 70% 1RM_30% VL | 16.5 ± 7.6 | 4.6 ± 1.7 | 70% 1RM_40% VL | 24.5 ± 7.8 | 3.8 ± 0.5 |
| 70% 1RM_45% VL | 18.0 ± 9.3 | 5.4 ± 1.6 | 70% 1RM_55% VL | 31.2 ± 5.6 | 4.9 ± 1.1 |
| 80% 1RM_10% VL | 11.6 ± 6.3 | 2.5 ± 0.8 | 80% 1RM_15% VL | 10.3 ± 3.4 | 2.4 ± 0.4 |
| 80% 1RM_20% VL | 15.0 ± 5.4 | 3.2 ± 1.0 | 80% 1RM_25% VL | 14.2 ± 7.6 | 2.9 ± 0.6 |
| 80% 1RM_30% VL | 14.6 ± 5.0 | 3.8 ± 2.0 | 80% 1RM_40% VL | 18.1 ± 7.9 | 3.5 ± 0.5 |
| 80% 1RM_45% VL | 18.6 ± 6.7 | 4.7 ± 2.0 | 80% 1RM_55% VL | 25.3 ± 6.8 | 4.5 ± 0.8 |
- SQ = ful back-quat exercise (n = 11); BP = bench press exercise (n = 10); REP = resistance exercise protocol; MPV = mean propulsive velocity; V1 m·s–¹ = load that elicited
- MPV of ~1 m·s–¹; RM = repetition maximum.
- Data are men ± SD Post-exercise lactate significantly different (P ˂ 0.001) from pre-exercise for all REPs.
- Significantly different than BP: p ˂ 0.001
- Significantly different than BP: p ˂ 0.01
- Significantly different than BP: p ˂ 0.05
Table 2. Loss of speed post effort with a load of 1 m s–¹ (central column in each exercise) lactate concentration in the squat (SQ) and bench press (BP) exercises (Rodríguez-Rosell et al., 2018).
the fatigue generated by the training section tends to be greater with the same loss of speed in the series the lower the relative intensity
Therefore, as indicated and shown in table 2, the loss of speed with the load of 1 m s–¹, as an indicator of the fatigue generated by the training section, tends to be greater with the same loss of speed in the series, the lower the relative intensity. When training with 50% of the RM in the bench press, 29.6% is lost for the four speed losses with which it was trained (15, 25, 40 and 55% of the speed of the first repetition), while with 60, 70 and 80%, 23.2, 20.6% and 17% were lost respectively. In the squat the losses were: 21.6, 18.7, 14.9 and 15% for 50, 60, 70 and 80%, respectively.
Attention should be paid to this detail, since there is a tendency to think that if the relative intensity is lower, the fatigue will also be less, which can lead to important errors: if the loss of speed is the same, the lower the relative intensity (at least from 50% of the RM, but it is very likely that it also occurs at lower intensities), the greater the fatigue. This, on the other hand, should not lead us to another probable error, such as thinking that then what you have to do is train with relatively high loads, which cause less fatigue, because this can also have important negative effects, since with high loads, the average speed of execution must necessarily be very low, which may not always have a positive effect on performance, but rather the opposite.
with high loads, the average execution speed must necessarily be very low, which may not always have a positive effect on performance, but rather the opposite.
Given that the lower the percentage with which you train, the more repetitions you can do until you lose a certain speed in the series, the loss of speed with the load of 1 m s–¹ It depends on the repetitions that have been made in the series when the percentages oscillate between 50 and 80% of the RM and its values have been estimated by the speed of the first repetition in the first series of the session.
In fact, the relationship between these variables is r = 0.94 (p˂0.001). But it is evident that the fatigue generated by the first repetition must also be included in the assessment of the character of the effort, since it is the first indicator of the degree of effort that a subject is going to make. This would lead us to try to find an index that would represent the degree of fatigue more accurately and with high validity.

This index should include the two variables that, as we have been proposing, can influence the fatigue generated: the speed of the first repetition (relative intensity) and the loss of speed in the series. Therefore, this index could be the result of multiplying the speed of the first repetition by the loss of speed in the session, which in this case consisted of three series.
Three sets at the maximum load for the session is a very common set number and is even considered to be within an effective set range for strength improvement (Rhea et al., 2002a; 2002b; 2003). This index is a way of presenting what has been proposed for years, the “character of effort” (CE), but each time more precisely defined. In this case, we could call this expression of the CE the Effort Index (IE), which is what it really represents, the degree of effort or degree of fatigue generated or caused to the person being trained.
Three series with the maximum load of the session is a very common series number and even considered as included within an effective range of series for the improvement of strength.
But, this IE needs to be validated by comparing its behavior and its values with an indisputable and clearly valid indicator of the degree of fatigue generated, such as the loss of speed under the same absolute load, which in this case is the load that can be moved at ~1 m s.–¹ before making the effort, as well as the loss of height of the vertical jump, which is equivalent to saying loss of speed in the jump, when it comes to exercises performed with the legs, and that we have been using since before the first contact platforms appeared in the 80s.
The values of this IE will be the result of multiplying the own speed of each percentage of the RM by the value of the loss of speed in the series or set of series. If, for example, the relative load (real percentage of the RM) with which you want to train has an average propulsive velocity of 1 m s-¹ and the loss of velocity that you want is 15%, the value of the IE resulting will be 15 (1×15).
Of course, when put into practice, this IE will not always have an exact value of 15, as the speed of the first repetition and the loss of speed in the set are not likely to always match the programmed values, but in practice, the differences are very small, so its value is practically the same as what has been programmed.
And if this is so, its effect must also be the same. It would not make sense to think that if instead of 15, the resulting IE had a value of 14.5, the effect would be different, especially since on another day it could be 15.3. To consider that these small differences could have a significant effect on the training result would be to give too much importance and power to IE, more than it already has.
Naturally, for the same loss of velocity in the series, the IE values are lower the higher the relative intensity, since the higher this is, the lower the velocity of the RM percentages. This should give rise, as has been shown in the results of the commented study, to that the speed losses with the load of 1 m s–1¹ (fatigue) tend to be lower with higher intensities, which, in turn, validates IE itself, because it determines the degree of fatigue (loss of speed in the series) based on its value as a product of the variables that make it up, not just based on the value of one of them.
Tables 3 and 4 show the IE calculations for the bench press and squat exercises.
| Stress Index Table
bench press Losses of velocity in the series or set of series |
||||||||||||
| WELL. con % 1RM | % of RM | 10 | 15 | 20 | 25 | 30 | 35 | 40 | 45 | 50 | 55 | 60 |
| 1,13 | 40 | 11 | 17 | 23 | 28 | 34 | 40 | 45 | 51 | 57 | 62 | 68 |
| 1,04 | 45 | 10 | 16 | 21 | 26 | 31 | 36 | 42 | 47 | 52 | 57 | 62 |
| 0,95 | 50 | 10 | 14 | 19 | 24 | 29 | 33 | 38 | 43 | 48 | 52 | 57 |
| 0,87 | 55 | 9 | 13 | 17 | 22 | 26 | 30 | 35 | 39 | 44 | 48 | 52 |
| 0,79 | 60 | 8 | 12 | 16 | 20 | 24 | 28 | 32 | 36 | 40 | 43 | 47 |
| 0,7 | 75 | 6 | 8 | 11 | 14 | 17 | 19 | 22 | 25 | 28 | 30 | 33 |
| 0,62 | 70 | 6 | 9 | 12 | 16 | 19 | 22 | 25 | 28 | 31 | 34 | 37 |
| 0,55 | 75 | 6 | 8 | 11 | 14 | 17 | 19 | 22 | 25 | 28 | 30 | 33 |
| 0,47 | 80 | 5 | 7 | 9 | 12 | 14 | 16 | 19 | 21 | 24 | 26 | 28 |
| 0,4 | 85 | 4 | 6 | 8 | 10 | 12 | 14 | 16 | 18 | 20 | 22 | 24 |
| 0,32 | 90 | 3 | 5 | 6 | 8 | 10 | 11 | 13 | 14 | 16 | 18 | |
| 0,25 | 95 | 3 | 4 | 5 | 6 | 8 | 9 | 10 | 11 | |||
Tabla 3. IE in the Bench Press Exercise (Rounded Values)
| Stress Index Table
squat Losses of velocity in the series or set of series |
||||||||||||
| Well con % 1RM | % of RM | 10 | 15 | 20 | 25 | 30 | 35 | 40 | 45 | 50 | 55 | 60 |
| 1,28 | 40 | 13 | 19 | 26 | 32 | 38 | 45 | 51 | 58 | 54 | 70 | 77 |
| 1,21 | 45 | 12 | 18 | 24 | 30 | 36 | 42 | 48 | 54 | 61 | 67 | 73 |
| 1,14 | 50 | 11 | 17 | 23 | 29 | 34 | 40 | 46 | 51 | 57 | 63 | 68 |
| 1,07 | 55 | 11 | 16 | 21 | 27 | 32 | 37 | 43 | 48 | 54 | 59 | 64 |
| 1 | 60 | 10 | 15 | 20 | 25 | 30 | 35 | 40 | 45 | 50 | 55 | 60 |
| 0,92 | 65 | 9 | 14 | 18 | 23 | 28 | 32 | 37 | 41 | 46 | 51 | 55 |
| 0,84 | 70 | 8 | 13 | 17 | 21 | 25 | 29 | 34 | 38 | 42 | 46 | 50 |
| 0,76 | 75 | 8 | 11 | 15 | 19 | 23 | 27 | 30 | 34 | 38 | 42 | 46 |
| 0,68 | 80 | 7 | 10 | 14 | 17 | 20 | 24 | 27 | 31 | 34 | 37 | 41 |
| 0,59 | 85 | 6 | 9 | 12 | 15 | 18 | 21 | 24 | 27 | 30 | 32 | |
| 0,51 | 90 | 5 | 8 | 10 | 13 | 15 | 18 | 20 | 23 | |||
| 0,42 | 95 | 4 | 6 | 8 | 11 | 13 | 15 | |||||
Tabla 4. IE in the Squat Exercise (Rounded Values)
The data in tables 3 and 4 are rounded, and may differ slightly from those published in the 2017 book on speed (González-Badillo et al., 2017). This is due to the fact that in that document the values of the IE were derived directly from the real data of the study, while in this case it is the calculation of each IE according to the own speed of the corresponding percentage and the expected loss of speed. The blank spaces in the tables are due to the fact that with the corresponding relative intensities a loss of speed as indicated cannot be produced.
0.14 and 0.27 m·s–¹ have been considered as the minimum possible speed in the series until muscular failure for the bench press and the squat, respectively. These values correspond to those obtained as a mean in the respective tests of the maximum possible number of repetitions in the series (tables 1 and 3).
Once these questions related to the concept of EI have been clarified, it is necessary to verify its validity as an indicator of the degree of effort or fatigue generated in training. For this, its relationship with the two reference criteria has been verified, the loss of speed with the load of 1 m·s–¹ and the loss of vertical jump (CMJ). The relationship of the IE and the loss of speed with the load of 1 m s–¹ was r = 0.98 (p ˂ 0.001) for the bench press and r = 0.091 (p ˂ 0.001) for the squat (figure 2).
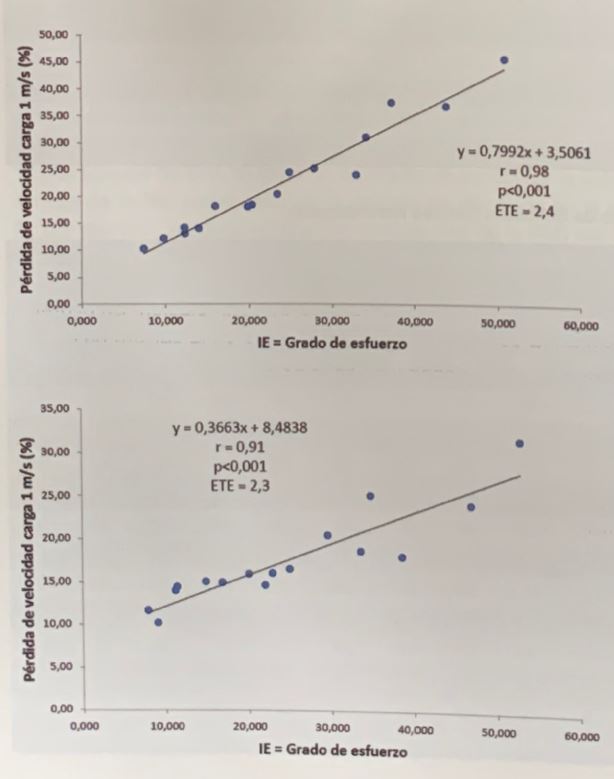
Figure 2. Relationship between IE (degree of effort) and velocity loss with 1 m s–¹ load in bench press (top figure and squat (bottom figure). TEE standard error of estimate. (Rodríguez-Roseel et al., 2018).
The Effort Index has a much higher predictive value than any other variable to estimate the loss of speed with a load of 1 m s-¹, that is, to estimate the degree of effort, which is what is programmed when designing a workout.
Therefore, this IE has a much higher predictive value than any other variable to estimate the loss of speed with a load of 1 m s–¹, that is, to estimate the degree of effort, which, as indicated, is what is programmed when designing a workout. If we quantify these relationships in terms of explained variance, we see that bench press IE explains 96% of the variance of velocity loss with the 1 m s-¹ load, virtually all of the variance, and squat IE 83%.
In other words, in both cases a very high percentage of the variance produced in the loss of speed with the load of 1 m·s–¹ is explained. The slightly lower value given in the squat may explain the greater technical complexity of this exercise compared to the bench press. In addition, the IE presents a high correlation with the loss of CMJ (r = 0.93; p ˂ 0.001; it explains 86.5% of the variance of the loss of high, and with a very low standard error of estimation: 1.8).
Therefore, these correlation values and their corresponding explained variance values provide us with high confidence in the predictive power of the IE in both exercises, with the particularity that the squat can be assessed by two exercises or fatigue indicator criteria.
But, in addition to what is indicated, the IE generated in the squat offers the opportunity to apply it to other variables related to an exercise frequently used in the training of any athlete, such as sprinting. In the commented study, the degree of fatigue throughout the 20-m race was also assessed. This test was performed ~2 minutes after the end of the effort. The relationships between the IE and a series of variables were: with the increase of the time in 20 m, r = 0.77 (p ˂ 0.001), with the loss of maximum speed, r = 0.84 (p ˂ 0.001) and with the increase of the contact time in the race, r = 0.66 (p ˂ 0.01). As can be seen, the IE in the squat has an important application in the prediction of fatigue in different types of performance.
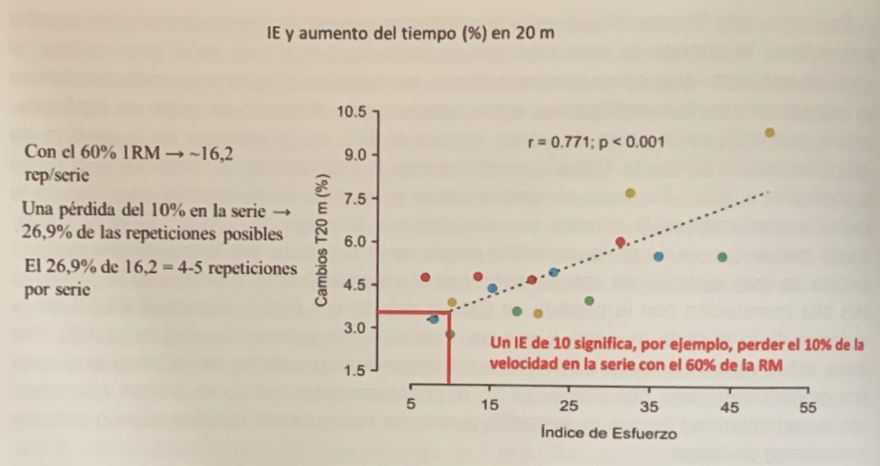
In this sense, the relationship observed in the IE in the full squat exercise and the reduction in performance in the 20-m race is pertinent and very relevant. Figure 3 shows the graphical presentation of this relationship.
In the graph it can be seen that for an IE of 10, the increase in time in the race is more than 3.5%. This is a very considerable acute negative effect. This is more relevant if we consider that the IE that causes this performance reduction is small. It is equivalent to performing 4-5 repetitions with a relative load of 60% of the RM. Which means that at 60% RM you should lose 10% of your speed for the first rep in the set.
As explained in the graph itself, with 60% you can do about 16 repetitions on average. A 10% loss of speed in the set means that 26.9% of the possible reps have been performed, and this is equivalent to doing 4-5 reps in the set. That is, this training, with three series, is a moderate-low training, which could be very positive for the improvement of performance for many athletes, but that has caused an acute negative effect on a 20 m race at ~2 minutes after doing the squat exercise.
It is natural, on the one hand, that if the interval time had been shorter, as is usual in some training practices, the negative effect would have been greater, and, on the other hand, that, according to the graph itself, with higher EI, the effects would tend to be even more negative.
Conclusion: the supposed “transfer” exercise, in addition to not being such, can be carried out in quite negative conditions.
Figure 3. Relationship between the IE and the change in time in a 20 m race performed ~2 minutes after performing the squat exercise (see text for further explanation) (Data taken from Rodríguez-Rosell’s doctoral thesis).
This sequence of exercises, but with less recovery time between them, is considered in some cases as a “transfer exercise” or executed in this way because in doing the second exercise “something is being transferred” to the second exercise. However, these results indicate that the supposed “transfer” exercise, in addition to not being such, is being carried out under quite unfavorable conditions, with each loss of performance.
It is logical to think that if 20-m runs are done, it is to be done at the subject’s maximum personal speed or close to it, or, in the worst case, with a minimum loss of speed, which would be enough to interrupt the training. However, with this sequence of exercise, so common, neither “transfers” nor trains in proper conditions, but rather the opposite.
In addition to the speed losses with the 1 m·s-¹ load, the CMJ is also a reference criterion for the assessment of fatigue. This exercise is also very easy to perform, it does not interfere with training and does not cause fatigue, therefore, if the loss of height were related to other exercises and with the loss of speed itself with the load of 1 m s–¹, could be a very useful exercise to assess the degree of fatigue reached in a training session easily, quickly and cheaply.
As expected, since the jump loss is a loss of speed, the loss of CMJ has a high relationship with the loss of speed with the load of 1 m s-¹, r = 0.96 (p ˂ 0.001), so in the squat exercise, to estimate the degree of fatigue, it would be equivalent to measure the loss of speed with the load of 1 m s-¹ or jump loss. But, in addition, the loss of CMJ serves as a good predictor of the increase in time in 20 (r = 0.79; p ˂ 0.001) and in 5 m (r = 0.84; p ˂ 0.001), of the loss of speed in the race (r = 0.77; p ˂ 0.001) and of the increase in contact time (r = 0.77; p ˂ 0.00 1).
If we take the regression equations indicated in figure 16.5 for the bench press and the squat, as well as the one associated with the CMJ in its relationship with the IE (y = 0.3306x + 9.3785), we can have a fairly approximate estimate of the loss of velocity with the 1 m s load.-¹ and of the CMJ before different values of EI (table 16.13).
With these data and those that have been commented on the variables that make up the EI, a wide field of research opens up. The first thing would be to determine the effect of the different IE values (Table 3). With these data and those that we have commented on the variables that make up the IE, a wide field of research opens up. The first thing would be to determine the effect of the different IE values, that is, of the different degrees of effort. There is still not enough data on this, although some guidelines will be given later that can serve as a reference to improve knowledge about the load-effect relationship of training.
| bench press | squat | CMJ | |
| IE | Lose. Well 1 m/s | Lose. Well 1 m/s | Lose. CMJ |
| 6 | 8,5 | 10,7 | 11,4 |
| 8 | 10,0 | 11,4 | 12,0 |
| 10 | 11,6 | 12,2 | 12,7 |
| 12 | 13,2 | 12,9 | 13,3 |
| 14 | 14,8 | 13,6 | 14,0 |
| 16 | 16,4 | 14,3 | 14,7 |
| 18 | 18,0 | 15,1 | 15,3 |
| 20 | 19,6 | 15,8 | 16.0 |
| 22 | 21,2 | 16,5 | 16,7 |
| 24 | 22,8 | 17,3 | 17,3 |
| 26 | 24,4 | 18,0 | 18,0 |
| 28 | 26,0 | 18,7 | 18,6 |
| 30 | 27,6 | 19,5 | 19,3 |
| 32 | 29,2 | 20,2 | 20,0 |
| 34 | 30,8 | 20,9 | 20,6 |
| 36 | 32,4 | 21,7 | 21,3 |
| 38 | 34,0 | 22,4 | 21,9 |
| 40 | 35,6 | 23,1 | 22,6 |
Tabla 3. Estimated values of velocity loss with the 1 m·s-¹ load and with the CMJ with a range of IE from 6 to 40.
In addition to what is indicated, the IE, the loss of speed with the load of 1 m·s-¹ and the CMJ present a high predictive validity of metabolic stress, estimated through the lactate concentration after the effort.
The IE, the loss of speed with the load of 1 m s-¹ and the CMJ have a high predictive validity of metabolic stress
In the commented study, the lactate concentration presented significant positive relationships with the IE in the bench press (r = 0.95; p ˂ 0.001) and the squat (r = 0.9; p ˂ 0.001), with the loss of speed with the load of 1 m s–¹ in the bench press (r = 0.95; p ˂ 0.001) and the squat (r = 0.95; 0.001) and with the jump loss (r = 0.98; p ˂ 0.001). As can be deduced from these results, knowing the speed loss with the load of 1 m s-1¹ and the loss of jump height, a very precise estimate of the lactate concentration can be made, or even better, if the values of these two variables are known, it is not necessary to do any post-exercise lactate concentration test, since what is really important is knowledge of the degree of effort, determined by fatigue, something that the lactate concentration cannot give us.
Taking all these data as a whole, justified by the high validity shown, we can admit that this form of expression of the character of the effort (EC) allows us to advance in the knowledge of the load (effort) that is programmed and, especially, of the load that has been generated in each subject once the training has been completed.

As an initial practical application, if we take into account, as indicated above, that what is programmed is a series or orderly succession of efforts, if one wants to compare the effect of different ranges of intensity on changes in strength, or in other types of performance, one would have to control a key variable in performance itself, such as the effort generated, that is, the CE / degree of effort of each session through the IE.
This means that it would not only be necessary to cIt is not necessary to control that the relative intensity was real and that the loss of speed in the series is also controlled through a precise measurement, but it would be necessary to ensure that the IE was equivalent, and for this it would be necessary that the losses of speed in the series were different for each relative intensity, so that the efforts were equalized.. Only if this is done in this way, it could be accepted that the independent variable of the study is truly the relative intensity.
Only if the effort indices are equalized could it be accepted that the independent study variable is the relative intensity
To our knowledge, this control has never been carried out, so stating that entertainment with a relative intensity is better or worse than another is not relevant if the IE that has been generated with the different intensities is not equivalent.
The character of the effort (EC) quantified through the IE also has an important function as an independent variable, in such a way that it could provide information on the effect that each relative intensity can have, and other variables that constitute the training load, depending on the IE applied or generated.
Apart from the fundamental application as a control variable and as an independent variable, the quantification of the CE through the IE allows a better analysis of the effects of any design, being able to verify the relationship between the IE and the effects produced, apart from other variables with less discriminatory power such as the series, the number of repetitions per series and even the relative intensities, since the same value of these last variables can mean a very different degree of effort depending on what the values of the others are.
As indicated above, today there is not enough data to be able to determine which IE is the one that can offer the best results, as well as with which variables this IE should be quantified or configured. Both issues must be considered, because, naturally, it is not the same to perform a squat training with an IE of 15, quantified by using 60% of the RM with a 15% loss of speed in the series (see table 16.12), than to train the same exercise with the same IE, but derived from using 85% of the RM and a loss of speed in the series of 25%.
Today there is not enough data to be able to determine which effort index is the one that can offer the best results, as well as with which variables this IE should be quantified or configured.
These two IE could generate a similar degree of fatigue, that is, a loss of speed with the load of 1 m s–¹ very similar, but there is an important differentiating factor between both IE, which is the average speed with which the training would be carried out, much lower when 85% of the RM is used. This could lead to clearly different effects. All these issues must be taken into account if we really want to advance in the knowledge about training in general, and especially if we want to use the speed of execution as a reference for the dosage and control of the load and the effect it produces.
Table 4 presents a series of data that can be considered as the first information about what the trend of the effect of different values of EI with different ranges of relative intensities may be. These are the real effects of two ranges of intensities: from 70 to 85% and from 55 to 70% of the RM in the squat exercise with different speed losses in the series.
In the first range he trained with four speed losses in the series: 10, 20, 30 and 40%. This resulted in the subjects training with certain IE, whose mean values were 7.5, 14.8, 22.1, and 29.4, for losses of 0, 20, 30, and 40%, respectively. If we take into account that the groups that obtained the best results were those that lost 10 and 20% of the speed in the series, and that the extreme values of EI of these two groups were 6 and 17, it can be suggested that these EI ranges are probably more favorable for improving performance with intensities between 70 and 85% than reaching higher values, between approximately 19 and 33. Or also, that average IE between 7.5 and 14.8 offer better results than values higher than 22.1.
Probably average ranges of the Effort index for the squat exercise with an intensity of 70 to 85% between 7.5 and 14.8 offer better results than values higher than 22.1.
In the second range of intensities, he trained with three speed losses: 10, 30 and 45%. This resulted in subjects training with mean EI values of 9.6, 28.5, and 42.7, for speed losses in the set of 10, 30, and 45%, respectively. The group that performed best was the one that lost 10%, with EI values between approximately 8 and 11, while EI values greater than 25 do not seem to offer the best results. Therefore, given a range of relative intensities from 55 to 70%, applying IE between 8 and 11 may be more favorable than using IE of 25 or more.
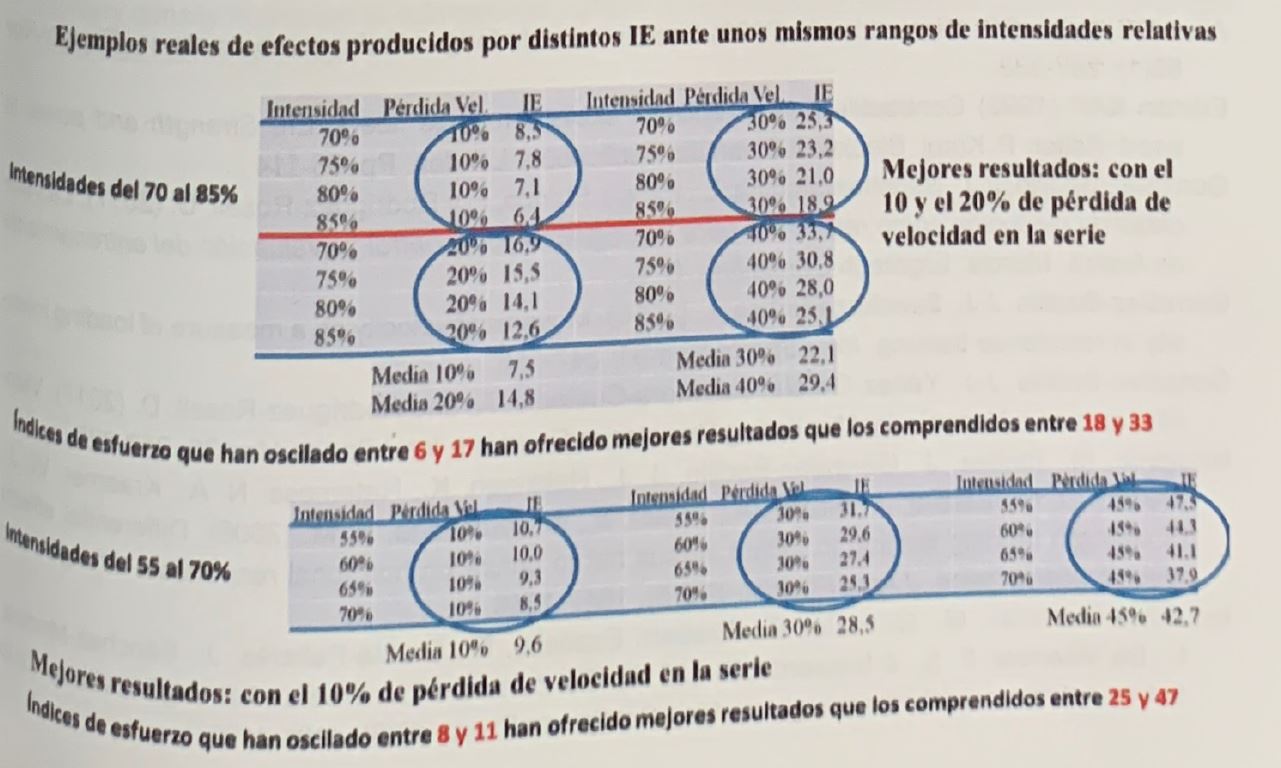
Tabla 4. Effect of different values of IE before different ranges of relative intensities. Explanations of likely effects are given in the table itself.
conclusions and practical applications on the effort index
- The high validity shown by the expression of the CE through the IE, as we do in this section, allows us to advance in the knowledge of the load (effort) that is programmed and, especially, of the load that has been generated in each subject once the training has been carried out.
- If we wanted to compare the effect of different ranges of intensity on changes in strength, or in other types of performance, it would be necessary to ensure that the IE was equivalent, and for this it would be necessary that the speed losses in the series or session were different for each relative intensity, so that the efforts were equalized. Only if this is done in this way, it could be accepted that the independent variable of the study is truly the relative intensity.
- Therefore, it is not pertinent to affirm that training with a relative intensity is better or worse than with another, if the IE that has been generated with the different intensities has not been controlled.
- The CE expressed through the IE can have at least the following applications:
-
- Act as an independent variable of any study on the effect of training.
- It is necessary and decisive as a control variable.
- It is very useful for a better analysis of the effects of any design, because it allows checking the relationship between the IE (degree of fatigue) and the effects produced.
- The choice of the speed of the first repetition and the choice of the loss of speed in the series or session can be done and in some cases should be done depending on the IE or degree of effort that we want to program.