Loss of Speed and Percentage of Repetitions Performed
In this article, a review will be made about the loss of speed and percentage of repetitions performed and how these parameters affect the character of the effort and the degree of fatigue regardless of the total number of repetitions performed in the series.
In an attempt to move towards a further development of the applications of speed control in strength training, it is worth asking the following: What is the relationship between 1) the speed of the first repetition, 2) the loss of speed in the series and 3) the percentage of repetitions performed in the series before a certain loss of speed? An adequate answer to this question can provide very relevant information to improve dosage and training control.
In this series of articles we deal with some of the most important concepts of strength training, collecting notes from the recently published book Strength, Speed and Physical and Sports Performance written by renowned researchers Juan José González Badillo and Juan Ribas Serna.
To the first two questions, the speed of the first repetition and the loss of speed in the series, we now add another concept, the percentage of repetitions performed in the series before a certain loss of speed. The reason why this new problem is addressed is because it has always been observed that not all subjects perform the same number of repetitions with the same ease at the same relative intensity, that is, at the same speed in the first repetition.

Once the intensity or relative load has been determined, whether it is expressed through inappropriate indicators, such as the percentage of 1RM or an XRM or nRM, or by the speed of the first repetition of a series, the training volume must be decided, of which the number of repetitions performed in the series is a decisive part. To decide on this component of the global training load, two criteria are followed: either do all the possible repetitions in the series, which, as is recognizable in all the literature, is usually the most frequent and almost the only alternative for many specialists, or fail to do all the possible repetitions in the series.
About the drawbacks of getting to do all the possible repetitions in the series has already been discussed previously.. Of all of them, the inconvenience that must be addressed in this case is related to the probable fact that being able to do the same maximum number of repetitions in a series before a determined absolute load (individual loads for each subject) does not mean that you are training with the same percentage of RM, since it has already been observed that there is variability between individuals in the number of repetitions that can be performed in a series before the same relative intensity (Richens & Cleather, 2014; Sakamoto & Sinclair, 2006; Shimano et al., 2006; Terzis, Spengos, Manta, Sarris, & Georgiadis, 2008).
Therefore, the hypothesis is that if several subjects have been able to perform, for example, 10 repetitions before certain absolute loads, a part of them will be training with a load close to 75% of 1RM, because the average number of repetitions that can be done with this percentage is ~10 repetitions, but there will be subjects who are training with 80%, because they are clearly capable of doing more repetitions per series than the average with any load, and others who are working with 7 0%, for the opposite reason.
doing the same maximum number of repetitions in a series before a certain absolute load (individual loads for each subject) does not mean that you are training with the same percentage of the RM
To try to analyze to what extent the subjects differ from each other when doing the maximum possible number of repetitions before the same relative load, determined in this case by the speed of the first repetition in the series, a study was carried out (González-Badillo et al., 2017) in which a group of 27 subjects performed, with intervals of 4 to 7 days, the maximum number of repetitions possible with loads equivalent to 50, 55, 60, 6 5, 70, 75, 80 and 85% of the RM. These percentages were determined each day based on the speed with which the absolute loads were moved in the first repetition.
| Load (%1RM) | VMPmax.
(m·s-¹) |
VMfinal
(m·s-¹) |
speed loss
(%) |
repetitions | Load (kg) |
| 50% (~0.93 (m·s-¹) | 0.93 ± 0.01
(0.91 – 0.94) |
0.14 ± 0.03
(0.09 – 0.22) |
84.7 ± 3.7 c, d, e, f
(76.1 – 90.5) |
25.7 ± 5.8 a, b, c, d, e, f
(19 – 40) |
37.7 ± 5.2 b, c, d, e
(27.5 – 45.0) |
| 55% (~0.86 (m·s-¹) | 0.86 ± 0.01
(0.84 – 0.88) |
0.14 ± 0.04
(0.08 – 0.22) |
82.2 ± 4.6 d, e, f
(74.4 – 90.1) |
22.7 ± 4.4 b, c, d, e, f
(16 – 32) |
40.9 ± 7.5 c, d, e
(29.0 – 55.0) |
| 65% (~0.71 (m·s-¹) | 0.71 ± 0.01
(0.69 – 0.73) |
0.14 ± 0.04
(0.07 – 0.25) |
80.4 ± 5.9 d, e, f
(66.1 – 90.1) |
16.2 ± 3.4 d, e, f
(12 – 22) |
46.8 ± 11.9 d, e
(34.5 – 61.0) |
| 70% (~0.62 (m·s-¹) | 0.62 ± 0.01
(0.60 – 0.64) |
0.13 ± 0.03
(0.06 – 0.18) |
79.2 ± 4.7 e, f
(70.5 – 90.3) |
12.6 ± 2.7 e, f
(9 – 19) |
54.1 ± 7.7 e
(34.5 – 65.0) |
| 75% (~0.54 (m·s-¹) | 0.62 ± 0.01
(0.60 – 0.64) |
0.13 ± 0.02
(0.08 – 0.19) |
75.7 ± 4.4 f
(65.6 – 84.0) |
9.8 ± 1.7 f
(7 – 13) |
57.5 ± 13.8
(39.0 – 72.5) |
| 80% (~0.47 (m·s-¹) | 0.47 ± 0.01
(0.45 – 0.49) |
0.12 ± 0.02
(0.08 – 0.16) |
73.6 ± 5.3 f
(65.9 – 82.9) |
7.7 ± 1.5
(5 – 10) |
63.0 ± 7.6
(44.0 – 75.0) |
| 85% (~0.39 (m·s-¹) | 0.39 ± 0.01
(0.37 – 0.41) |
0.14 ± 0.02
(0.11 – 0.18) |
63.9 ± 5.1
(54.8 – 73.2) |
4.9 ± 1.2
(4 – 8) |
68.3 ± 10.4
(48.0 – 88.0) |
Tabla 1. Descriptive variables related to performing the maximum number of repetitions possible in the series with different relative intensities. (González-Badillo et al., 2017).
- Data are expressed as mean ± SD and (range)
- Repetitions: number of repetitions performed in the series; VMPmax: maximum average propulsive speed in the series; Final VMP: average propulsive velocity in the last repetition of the series.
- Diferencias significativas con respecto al: ͣ60% 1RM, b 65% 1RM; C 70% 1RM; d 75% 1RM; e 80% 1RM; f 85% 1RM.
- Table 1 shows the results corresponding to the bench press exercise.
- In the first column the percentages and the speeds corresponding to said percentages in the first repetition are indicated.
- The second column indicates the actual average speed at which the loads indicated in the first column were made and the range around the average. It can be seen that the average coincides with the target speed and that the maximum deviation in any subject was ±0.02 m·s–¹ in any of the loads. This represents the maximum adjustment that can be required in any study or in training practice, since it cannot be expected that in all subjects the speed coincides exactly with the predicted speed. This small margin is tolerable and realistic to carry out any study or to carry out training.
The third column has an important informative value, because it indicates the average speed of the last repetition with each load. It can be seen that in all loads the final speed is practically the same. This speed, as we have always maintained, must coincide with the speed of the RM, because the last possible repetition in a series is precisely the last because it is done at the speed of the RM.
In this case, this speed is even slightly below the average speed of the MRI of this exercise, which, as we have seen in the previous chapter, is 0.16-0.18 m·s-¹. Naturally, there is also a small range of speeds around the average. The importance of this variable lies in the fact that if the last repetition had not been performed at the speed typical of the MRI, the test would not be valid, since this would be proof that the subjects had not performed the maximum possible number of repetitions in their tests.

The loss of speed in the series, shown in a fourth column, decreases as the relative intensity increases, since each time you start from a lower speed and always reach the same final speed. It is not relevant information, but it can serve as a reference to differentiate the intensities in relation to the maximum loss of speed that can be experienced with them.
The fifth column shows the repetitions performed with each percentage. The average values inform us of the approximate number of repetitions that can be done with certain intensities, but with the particularity that in this case we can have high confidence that the intensities with which the tests have been done adjust with high precision to the actual intensities under analysis.
there is a wide range of repetitions achievable by different subjects at the same relative intensity
But the most relevant information in this column is that there is a wide range of repetitions that can be performed by different subjects at the same relative intensity. The average coefficient of variation is approximately 20% and there is a subject that doubles the number of repetitions that another can do at all intensities. If we take into account the standard deviations, we find that, for example, in the smallest load, 50% of the RM, 68% of the subjects would be in repetition values between 19.9 and 31.5 repetitions, a percentage difference of 58% between the maximum and minimum value. And at the highest load, 85% RM, 68% of the subjects would be between 3.7 and 6.1 repetitions, a 65% percentage difference between the maximum and minimum value. Two important practical applications can be deduced from the results of this study.
The first is that, if the maximum possible number of repetitions is programmed for all the subjects, most of them would train with intensities (RM percentages) different from the others, given the variability that exists in the maximum number of repetitions that can be done at the same relative intensity.
Secondly, if we consider the case in which the maximum possible number of repetitions in the series is not programmed, the usual thing is to program the same number of repetitions for all the subjects with the same percentage of the RM. This way of determining the load has fewer drawbacks than most, but still has the same problem related to the discrepancy between the degree of effort programmed and the actual effort that represents the same number of repetitions for each subject.
This is so because even assuming that the first repetition of the series was done with the same relative intensity, doing the same number of repetitions with said intensity does not mean that all the subjects are making the same degree of effort: same loss of speed in the series. This is justified with the same argument previously exposed: the variability in the number of repetitions possible with the same relative intensity.
Indeed, given that not all subjects can perform the same repetitions at the same relative load, if a non-maximum number of repetitions is performed in the series, but common to all subjects, each subject will have done a different percentage of the total number of repetitions possible for him. This means that, having trained with the same relative intensity and number of repetitions in the series, the degree of fatigue, the loss of speed in the series, the degree of effort or character of the effort could have been different in each case.

This situation, which seems to lead us to a “dead end”, can be addressed and solved if we manage speed properly. If we start from the same speed before the first repetition of a series, that is, from the same relative intensity, it is reasonable to think that the degree of effort that the first repetition means is the same or extremely similar for all subjects (González-Badillo & Sánchez-Medina, 2010). Therefore, what we have left to solve is the degree of fatigue or effort that is added to the effort that the first repetition has represented. Naturally, this added effort will be determined by the number of repetitions done in the series, or more precisely, by the loss of speed in the series.
So, if we take into account that the degree of effort or fatigue generated in the series has a high relationship with the loss of speed in the series (Sánchez-Medina and González-Badillo, 2011), what we should control would be precisely this loss of speed. Indeed, given that fatigue can be estimated and controlled through the loss of speed (Edman, 1992; Allen, Lamb, & Westerblad, 2008; Sánchez-Medina & González-Badillo, 2011), it is reasonable to assume that in the event of the same loss of speed in the series, the degree of fatigue, effort or the nature of the effort will be very similar.
Once all of the above is accepted and the hypothesis formulated, what remains to be confirmed is whether, indeed, in the face of the same loss of speed, the nature of the effort is similar, that is, if in the face of the same loss of speed in the series, the relationship between the repetitions that are done and those that can be done in the series is the same or very similar in all cases.
If this is the case, it can be assumed that the degree of effort made is very similar for all subjects who have trained with the same relative intensity (same speed in the first repetition of the series) and have lost the same speed in the series, even though the number of repetitions performed has not been the same for all. Indeed, in the study that we have been commenting on (González-Badillo et al, 2017) it has been verified that when a certain percentage of execution speed is lost in the series, the same percentage of possible repetitions in the series has been performed regardless of the number of repetitions that can be done in the series itself.
It has been verified that when a certain percentage of execution speed is lost in the series, the same percentage of the possible repetitions in the series has been performed, regardless of the number of repetitions that can be done in the series itself.
| VMP loss (%) | |||||||||||||
| Charge
(% 1RM) |
15% | 20% | 25% | 30% | 35% | 40% | 45% | 50% | 55% | 60% | 65% | 70% | 75% |
| 50%
(~0.93 m·s-¹) |
31.2 | 39.1 | 46.4 | 53.3 | 59.7 | 65.6 | 71.0 | 75.9 | 80.3 | 84.2 | 87.6 | 90.6 | 93.0 |
| 55%
(~0.86 m·s-¹) |
31.4 | 39.3 | 46.7 | 53.6 | 60.1 | 66.1 | 71.6 | 76.7 | 81.3 | 85.5 | 89.2 | 92.4 | 95.1 |
| 60%
(~0.79 m·s-¹) |
29.8 | 37.3 | 44.3 | 51.1 | 57.4 | 63.4 | 69.0 | 74.2 | 79.1 | 83.6 | 87.7 | 91.4 | 94.8 |
| 65%
(~0.71 m·s-¹) |
32.1 | 39.8 | 47.1 | 53.9 | 60.4 | 66.4 | 72.0 | 77.2 | 82.0 | 86.3 | 90.3 | 93.8 | 96.9 |
| 70%
(~0.62 (m·s-¹) |
32.5 | 38.7 | 45.7 | 52.3 | 58.6 | 64.5 | 70.1 | 75.4 | 80.4 | 85.0 | 89.3 | 93.3 | 96.9 |
| Media ± dt | 31.2
± 0.8 |
38.8
± 1.0 |
46.0
± 1.1 |
52.8
± 1.2 |
59.2
± 1.2 |
65.2
± 1.2 |
70.7
± 1.2 |
75.9
± 1.2 |
80.6
± 1.1 |
84.9
± 1.1 |
88.8
± 1.1 |
92.3
± 1.3 |
95.4
± 1.6 |
| CV (%) | 2.7 | 2.5 | 2.3 | 2.2 | 2.1 | 1.9 | 1.7 | 1.5 | 1.4 | 1.3 | 1.3 | 1.4 | 1.7 |
Tabla 2. Percentage of repetitions performed with respect to the total number of possible repetitions in the series before different percentages of loss of speed in relative intensities between 50 and 70% of the RM (González-Badillo et al., 2017)
VMP: mean propulsive velocity; CV: Coefficient of variation.
Table 2 shows the data related to intensities between 50 and 70% of the MR. In this range of intensities, it can be seen that when faced with the same loss of speed in the series, the subjects tend to perform the same percentage of the total number of repetitions possible in the series at all intensities. For example, with a loss of 15% of the speed of the first repetition, at all these intensities practically the same percentage of possible repetitions has been performed, with an average of 31.2%.
Confidence in this data is based on the low coefficient of variation that accompanies it, of only 2.7%, which is also the highest of all the coefficients. If the standard deviation is taken as a reference, 68% of the subjects would be between 30.4 and 32% of repetitions performed with respect to the total possible, an extremely narrow range. Furthermore, it can be seen that the coefficient of variation decreases as the speed loss increases. This indicates that the greater the loss of speed in the series, the more similar is in all the subjects the percentage of repetitions performed before the same loss of speed in the series with all the relative intensities from 50 to 70% real of the RM.
Therefore, given the same relative intensity between 50 and 70% of the RM, if the same loss of speed occurs in the series, we can consider that the degree of effort will be similar, even though each subject has performed a different number of repetitions.
At intensities of 75, 80, and 85% of the RM, the percentage of repetitions performed at the same loss of speed is 2.5, 5, and 10% higher than that performed with intensities between 50 and 70%, respectively. For example, for the same percentage of repetitions performed, when at intensities between 50 and 70%, 10% with 80% and 5% with 85%. The speed losses for the same percentage of repetitions performed are in figure 1.
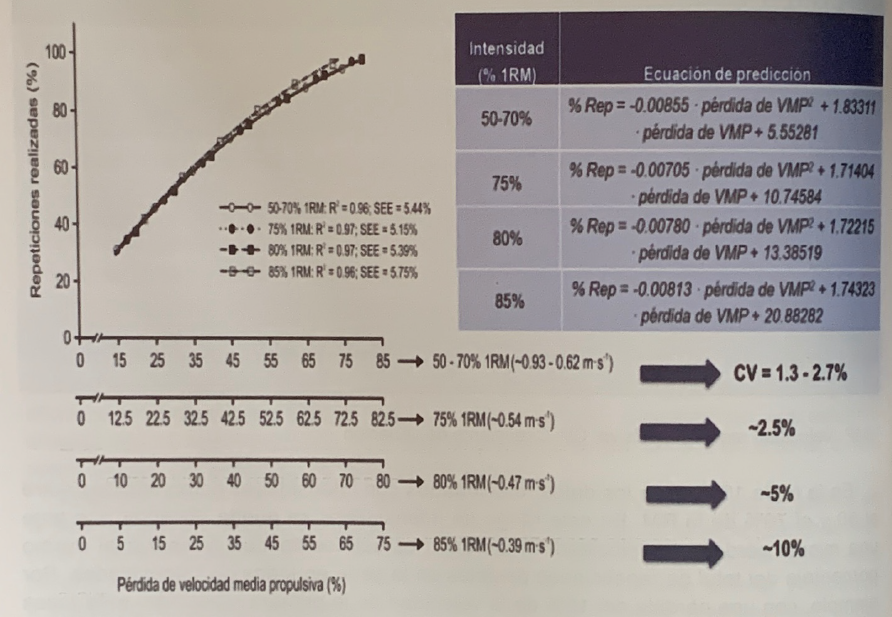
Figure 1. Losses of speed in the series with relative intensities from 50 to 85% of the RM (the 4 “X” axes) for the same percentage of repetitions performed (“Y” axis) (González-Badillo et al., 2017)
These differences are easily understandable, since as the number of repetitions possible in the series is reduced, each repetition represents a greater percentage of the total number of repetitions that can be performed. However, this natural tendency only starts to manifest itself after you can do ~10 reps in the set (~75% of 1RM). If the number of repetitions possible is greater, as occurs from 50 to 70% of the RM, the number of repetitions possible in the series does not even influence the common percentage of repetitions performed between different intensities before the same loss of speed.
The data that we have provided in relation to the bench press exercise has also been studied in the full squat exercise (Rodríguez-Rossell et al., 2019). Table 16.3 presents the results of the study in the squat with the four relative intensities that were directly analyzed: 50, 60, 70 and 80% of the RM.
| -50% 1RM | -60% 1RM | -70% 1RM | -80% 1RM | |||||
| BP (~0.93
m·s-¹) |
SQ (~1.13
m·s-¹) |
BP (~0.79
m·s-¹) |
SQ (~0.98
m·s-¹) |
BP (~0.62
m·s-¹) |
SQ (~0.82
m·s-¹) |
BP (~0.48
m·s-¹) |
SQ (~0.68
m·s-¹) |
|
| VMP MAX
m·s–¹ |
0.93 ± 0.01
(0.94-0.91) |
1.13 ± 0.02
(1.16– 1.10) |
0.79 ± 0.01
(0.81-0.77) |
0.99 ± 0.01
(1.01-0.96) |
0.62 ± 0.01
(0.64-0.60) |
0.82 ± 0.01
(0.85-0.79) |
0.47 ± 0.01
(0.49-0.45) |
0.69 ± 0.02
(0.71-0.66) |
| VMP última mpd (m·s–¹) | 0.14 ± 0.03
(0.22-0.09) |
0.28 ± 0.04
(0.35-0.19) |
0.13 ± 0.02
(0.19-0.09) |
0.26 ± 0.07
(0.42-0.16) |
0.13 ± 0.03
(0.18-0.06) |
0.29 ± 0.04
(0.37-0.24) |
0.12 ± 0.02
(0.16-0.08) |
0.27 ± 0.04
(0.34-0.21) |
| Speed loss (%) | 84.8 ± 3.8
(90.5-76.1) |
75.5 ± 3.9
(83.1-68.9) |
83.7 ± 3.
(88.1-76.3) |
73.6 ± 6.6
(87.9-56.6) |
79.3 ± 4.8
((90.3-70.5) |
64.6 ± 4.7
(70.7-55.8) |
73.9 ± 5.3
(82.9-65.9) |
60.2 ± 6.7
(70.2-48.9) |
| REP | 25.2 ± 5.5
(40 – 19) |
23.4 ± 7.7
(44 – 15) |
19.3 ± 2.8
(24 – 15) |
16.2 ± 5.0
(31 – 10) |
12.3 ± 2.3
(18 – 9) |
9.6 ± 3.5
(18 – 5) |
7.7 ± 1.5
(10 – 5) |
6.0 ± 1.5
(10 – 4) |
| Load (kg) | 38.0 ± 5.2
(45 – 27.5) |
60.5 ± 11.3
(90 – 47.5) |
44.6 ± 6.8
(55 – 30) |
72.0 ± 11.8
(99 -57.5) |
54.4 ± 7.8
(65 – 34) |
84.8 ± 12.6
(111 – 67.5) |
63.1 ± 7.8
(74 – 44) |
92.6 ± 14.4
(122.5-73.0) |
Tabla 3. Characteristics of the bench press and squat efforts with loads of 50, 60, 70 and 80% of 1RM: basic similarities and differences (Rodríguez-Rosell et al., 2019).
In the squat exercise in Table 3, it can be seen that the measurements of the speed of the first repetition coincide with the speed of the percentages that are analyzed. It can also be seen that the last repetition of the series with each intensity is typical of RM, and even somewhat below average, which indicates that the subjects really performed the maximum number of repetitions possible.
The number of repetitions performed in the squat exercise for the same relative intensity is slightly lower than in the bench press, between 2 and 3 repetitions less. The coefficient of variation in the number of repetitions is somewhat higher than in the bench press, with an approximate average of 30%.
Given the characteristics of the squat exercise in terms of the degree of demand or effort required to perform series until exhaustion, in this exercise only the four indicated relative intensities were measured. Taking these four intensities and the corresponding number of repetitions performed with each of them as a reference, we have calculated the number of repetitions that could be done with a greater range of relative intensities. The fit of the four relative intensities and the repetitions performed with them was almost perfect: R2 = 0.9996. This adjustment is presented in Figure 2.
Based on the regression equation corresponding to the relationship between these two variables, we have estimated the repetitions with other intensity values. Table 4 presents these data. The first column indicates the percentages of the RM, in the second the estimation of the number of repetitions performed with each percentage of the RM and in the third the number of repetitions measured directly with the percentages of 50, 60, 70 and 80% of the RM.
It can be seen in this table that the differences between the number of repetitions measured and the one estimated with these intensities are practically nil. Then the estimated replicate values can be considered. Very adjusted to the real mean of repetitions that a population of young subjects familiar with strength training would do, with a mean of 115 kg RM for 76 kg of mean body weight, and with a range from 91 to 153 kg of RM value. Therefore, these results would be applicable to a wide population.
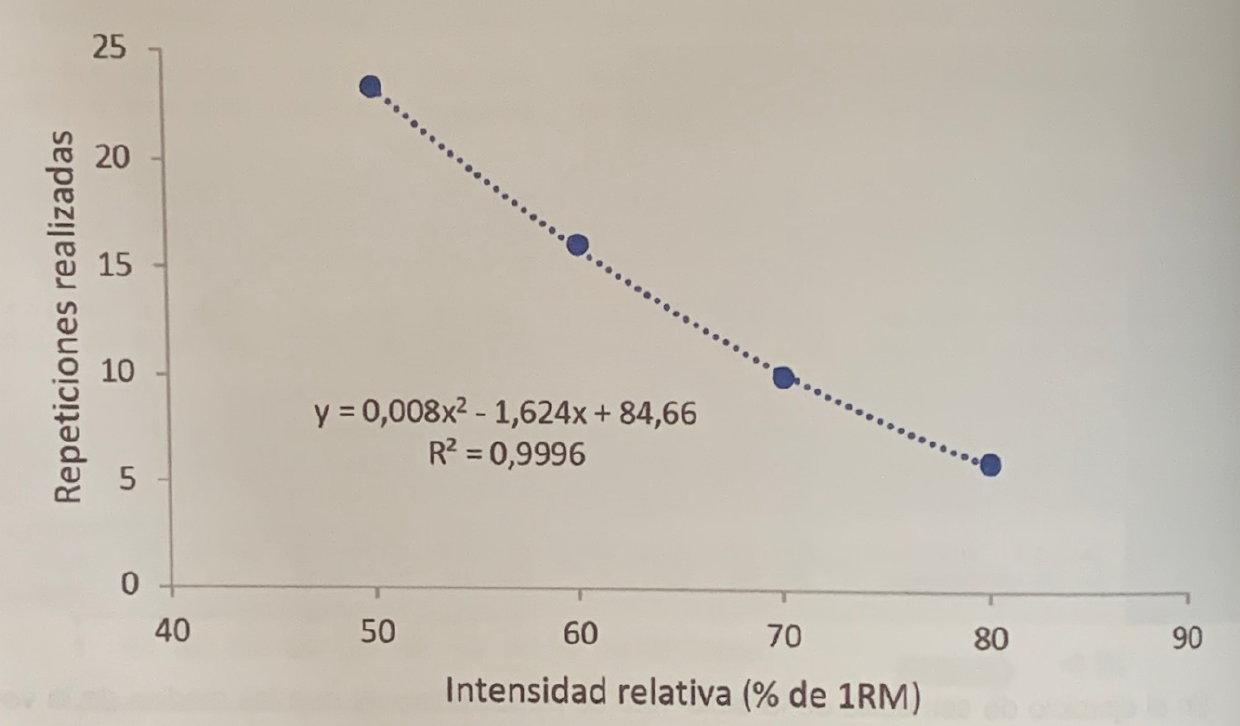
Figure 2. Relationship between the relative intensities of 50, 60, 70 and 80% of the RM and the number of repetitions performed with each of them in the squat exercise (Graphic prepared with data extracted from Rodríguez-Rosell et al., 2019).
| % 1RM | Rep_estimated | Rep_measurements |
| 40 | 32,5 | |
| 45 | 27,8 | |
| 50 | 23,5 | 23,4 |
| 55 | 19,5 | |
| 60 | 16,0 | 16,2 |
| 65 | 12,9 | |
| 70 | 10,2 | 10 |
| 75 | 7,9 | |
| 80 | 5,9 | 6 |
| 85 | 4,4 | |
| 90 | 3,3 |
Tabla 4. Estimated repetitions with intensities between 40 and 90% of the RM and repetitions measured directly with the intensities of 50, 60, 70 and 80% of the RM in the squat exercise.
Following the same reasoning exposed for the bench press, once the speed with which each percentage of the RM is moved in the squat and the number of repetitions that can be performed with each percentage in this exercise is known, what remains to be solved is the degree of fatigue or effort that is added to the effort represented by the first repetition in the series.
Naturally, this added effort will be determined by the number of repetitions done in the series, but, as we can see in Table 3, as in the bench press, the maximum number of repetitions to exhaustion can vary greatly between subjects, so we will have to resort to the loss of speed in the series to try to equalize the efforts or fatigue, ruling out the number of repetitions to be carried out in the series as a priority reference in programming.
Therefore, from a practical point of view, we would have to establish what percentage of the total repetitions has been performed when a certain speed has been lost in the series. In the study that is being discussed (Rodríguez-Roseel et al., 2019) this data has also been verified when a certain percentage of the speed of execution is lost in the series with the intensities of 50, 60, 70 and 80% of the RM. Table 5 shows the results.
| Porcentage of repetitions completed | ||||||||
| 50% 1RM | 60% 1RM | 70% 1RM | 80% 1RM | |||||
| BP | SQ | BP | SQ | BP | SQ | BP | SQ | |
| Velocity loss (%) | (~0.93 m·s–¹) | (~1.13 m·s–¹) | (~0.79 m·s–¹) | (~0.98 m·s–¹) | (~0.62 m·s–¹) | (~0.82m·s–¹) | (~0.48 m·s–¹) | (~0.68 m·s–¹) |
| 10 | 23.0 ± 2.8 | 25.6 ± 6.2 | 21.3 ± 3.5 | 26.9 ± 5.7 | 23.4 ± 3.3 | 32.6 ± 6.6 | 29.7 ± 3.4 | 36.6 ± 5.6 |
| 15 | 31.4 ± 3.4 | 34.7 ± 7.0 | 29.0 ± 3.5 | 35.6 ± 6.8 | 31.0 ± 3.5 | 41.2 ± 7.8 | 37.1 ± 4.0 | 44.4 ± 6.7 |
| 20 | 39.4 ± 4.1 | 43.3 ± 7.7 | 37.4 ± 3.7 | 43.8 ± 7.6 | 38.4 ± 3.8 | 49.3 ± 8.7 | 44.2 ± 4.6 | 51.9 ± 7.8 |
| 25 | 46.8 ± 4.7 | 51.2 ± 8.2 | 44.4 ± 3.8 | 51.4 ± 8.2 | 45.4 ± 4.2 | 56.9 ± 9.3 | 51.0 ± 5.2 | 59.0 ± 8.7 |
| 30 | 53.7 ± 5.1 | 58.6 ± 8.5 | 51.1 ± 4.0 | 58.6 ± 8.5 | 52.2 ± 4.5 | 63.9 ± 9.5 | 57.4 ± 5.6 | 65.7 ± 9.4 |
| 35 | 60.2 ± 5.5 | 65.4 ± 8.5 | 57.5 ± 4.1 | 65.3 ± 8.5 | 58.6 ± 4.7 | 70.4 ± 9.4 | 63.5 ± 5.9 | 72.0 ± 9.9 |
| 40 | 66.1 ± 5.7 | 71.7 ± 8.2 | 63.5 ± 4.1 | 71.4 ± 8.2 | 64.7 ± 4.7 | 76.4 ± 8.9 | 69.3 ± 6.1 | 77.9 ± 10.3 |
| 45 | 71.5 ± 5.7 | 77.3 ± 7.7 | 69.2 ± 4.1 | 77.1 ± 7.7 | 70.5 ± 4.7 | 81.8 ± 8.0 | 74.7 ± 6.1 | 83.4 ± 10.7 |
| 50 | 76.5 ± 5.6 | 82.4 ± 6.9 | 74.6 ± 4.0 | 82.3 ±6.9 | 75.9 ± 4.6 | 86.7 ± 6.9 | 79.8 ± 5.9 | 88.5 ± 11.0 |
| 55 | 80.9 ± 5.3 | 86.9 ± 5.8 | 78.6 ± 3.8 | 86.9 ± 6.1 | 81.1 ± 4.5 | 91.1 ± 5.6 | 84.5 ± 5.6 | 93.3 ± 11.3 |
| 60 | 84.8 ± 4.9 | 90.8 ± 4.6 | 83.2 ± 3.6 | 91.1 ± 5.3 | 85.9 ± 4.3 | 94.9 ± 4.4 | 88.9 ± 5.2 | 97.6 ± 11.8 |
| 65 | 88.3 ± 4.4 | 94.1 ± 3.3 | 87.6 ± 3.4 | 94.8 ± 5.1 | 90.5 ± 4.1 | 98.2 ± 4.2 | 93.0 ± 4.8 | 101.6 ±12.5 |
Table 5. Percentage of repetitions performed before a certain loss of speed in the series in relation to the maximum possible repetitions in the series until exhaustion in the bench press and squat exercises with the indicated RM percentages (Rodríguez-Rosell et al., 2019).
*1RM = 1 repetition máximum; BP = bench press; SQ = full squat.
- Data are mean ± SD.
- Statistically significant differences with respect to: 50% 1RM.
- Statisticaly significant differences with respect to: 60% 1RM.
- Statisticaly significant differences with respect to: 70% 1RM.
- BP exercise.
In the first column of table 16.5 we have the loss of speed in the series and in the rest the percentage of repetitions performed before each loss of speed with the different relative intensities in each exercise. It can be observed that the percentage of repetitions performed before the same loss of speed in the series is always higher in the squat (SQ) than in the bench press (BP), and the difference tends to increase the higher the intensity.
In addition, while in the bench press the percentage of repetitions performed for the same loss of speed remains practically stable up to 70% of the RM, as we have already seen when analyzing this exercise in previous paragraphs, in the squat only stability is maintained. with 50 and 60%, increasing the percentage of repetitions performed for the same loss of speed with 70% and even more with 80%.
The circumstance occurs that the increases in the percentage performed before the same loss of speed begin in both exercises when with the corresponding intensity it is possible to do an average of ~10 maximum repetitions, which corresponds to 70% in the squat and 75% in the bench press. It seems, therefore, that the influence of the possible number of repetitions in the series on the percentage of repetitions performed for the same loss of speed in the series is maintained in the squat. (Note: naturally, in Table 5, the value of speed loss of 65% with the relative load of 80% should be discarded, which is a mistake, since it would exceed 100% of the repeats that can be carried out).
Unfortunately, the information on the squat exercise is somewhat scarcer than the bench press, as only four percentages of the RM could be analyzed, but it allows for very useful applications.

On the one hand, based on the data obtained, the values corresponding to 55% of the RM can be estimated, since, if the values of the percentages of repetitions performed are the same with 50 and 60%, it is reasonable to accept that the values corresponding to 55% would also be equal to both. This is logical, but it is also reinforced by the results obtained in the bench press: the intermediate values (55, 60 and 65%) between 50 and 70% are equal to those of these two extreme values, which are also equal to each other. In addition, an estimate of the corresponding 75% values could also be made, which must be of an intermediate value between 70 and 80%, in the same way that it occurred in the bench press between 75, 80 and 85%.
But perhaps the most useful thing is to check that when 20% of the speed has been lost in the squat exercise, we are slightly below half of the possible repetitions in the series with all percentages of the RM except 80% where we are practically half. If it is taken into account that in the investigations carried out to date (Pareja-Blanco et al., 2017; Rodríguez-Rosell, Doctoral Thesis) in which the loss of speed in the series has been taken as a reference to control the training dosage, it is observed that exceeding a loss of 20% of the loss of speed in this exercise already begins to cause a decrease in the training effect, being able to control losses of 10, 15 and 20%, even 25%, allows the control of most or all of the training that an athlete must do in his sporting life.
In addition, we can also remember those other studies, although somewhat less controlled, in which doing half of the possible repetitions offered a better result than reaching muscular failure (maximum loss of speed in the series) (Izquierdo-Gabarren et al., 2010 )
This practical application, naturally, translates into the possibility of being able to tell the athlete to perform the movement at the maximum possible speed until losing 10, 15 or 20% of the speed of the first repetition, without indicating the number of repetitions. what it has to do.
This would make it possible to equalize the effort (the degree of fatigue) that we are asking of all the athletes, which could not be done by prescribing an equal number of repetitions to all the subjects.
En relación con el grado de esfuerzo o fatiga, en este estudio se confirmo la alta relación entre la pérdida de velocidad en la serie y la fatiga, determinada por la pérdida de velocidad pre-post esfuerzo con la carga que se podía desplazar a 1 m·s–¹. A relationship was found between these two variables of r = 0.97 in the bench press and r = 0.99 in the squat. It must be taken into account that, as can be seen in table 16.3, the range of repetitions with the percentages analyzed was wide, so this relationship occurred independently of the number of repetitions performed by each subject.
One question that we ask ourselves is whether the relationship of these tests with the maximum possible number of repetitions in the series was reliable or not. To verify this, we did a repetition of the test one week apart with a load of 60% of the RM. Table 16.6 shows the results of both tests.
| Tests | VPM BEST (m s–¹) | VPM ULTIMA (m·s–¹) | Pérdida de velocidad (%) | repetitions | Loads (KG) |
| Tests 1 | 0.80 ± 0.01
(0.81 – 0.77) |
0.14 ± 0.04
(0.22 – 0.07) |
81.4 ± 5.3
(90.9 – 71.3) |
17.6 ± 3.7
(11 – 25) |
49.7 ± 10.5
(28 – 67) |
| Tests 2 | 0.79 ± 0.01
(0.81 – 0.77) |
0.4 ± 0.05
(0.23 – 0.07) |
81.8 ± 5.7
(91.1 – 73.5) |
17.6 ± 3.2
(11 – 25) |
49.3 ± 10.7
(27 – 67) |
VMP: mean propulsive velocity.
Tabla 6. Data on performing a test to exhaustion on two occasions with a load equivalent to 60% of the MRI (Data taken from Rodríguez-Rosell’s doctoral thesis).
It can be seen that all the data are practically the same in both tests, which confirms the stability of carrying out tests with these characteristics. Special attention should be paid to the column of the last repetition of the series, which is repeated almost exactly, with the same average speed and range of speeds, as well as the column of repetitions performed, with the same number and range of repetitions, which It confirms, on the one hand, the stability in the number of repetitions that a person can do at a given relative intensity, and on the other, the stability in the variability between subjects in the number of repetitions that can be performed at the same initial speed.
In addition, the percentages of repetitions performed before different speed losses in the series were practically the same in both tests (table 7).
| Speed loss (%) | Test 1 | Test 2 | CV (%) |
| 15 | 29.6 ± 4.6 | 30.0 ± 3.3 | 6.6 |
| 20 | 37.1 ± 5.2 | 37.4 ± 3.8 | 6.0 |
| 25 | 44.2 ± 5.6 | 44.6 ± 4.2 | 5.5 |
| 30 | 51.0 ± 5.8 | 51.3 ± 4.5 | 5.1 |
| 35 | 57.4 ± 5.9 | 57.8 ± 4.7 | 4.7 |
| 40 | 63.5 ± 5.9 | 63.8 ± 4.7 | 4.3 |
| 45 | 69.3 ± 5.8 | 69.6 ± 4.5 | 3.8 |
| 50 | 74.7 ± 5.5 | 75.0 ± 4.3 | 3.3 |
| 55 | 79.8 ± 5.1 | 80.0 ± 3.9 | 2.8 |
| 60 | 84.6 ± 4.6 | 84.7 ± 3.4 | 2.4 |
| 65 | 89.0 ± 4.1 | 89.1 ± 2.9 | 2.2 |
| 70 | 93.1 ± 3.7 | 93.1 ± 2.6 | 2.2 |
| 75 | 96.8 ± 3.5 | 96.7 ± 2.7 | 2.1 |
Tabla 7. Percentages of repetitions performed for different speed losses in the series in two tests with 60% of the RM (Data taken from Rodríguez-Rosell’s doctoral thesis).
Another issue that caused concern was whether, having reached the same loss of speed in the series, the subjects who tended to do more repetitions in the series had experienced more fatigue than those who did less. To do this, the subjects were divided into two halves, one made up of the subjects who had done more repetitions (high repetitions group: GAR) and the other by those who had done less (low repetitions GBR group). Table 16.8 presents the results of the grouping of the subjects and the average number of repetitions performed with each percentage of the RM. It can be seen that the GAR performed an average of 32% more repetitions than the GBR in the bench press and 59% more in the squat, giving rise to statistically significant differences between both groups in all relative intensities.
Do the subjects who do more repetitions in the series fatigue more in the face of the same loss of speed and relative intensity?
| PB | squat | |||
| Intensity
(% 1RM) |
GBR (n = 10) | GAR (n = 10) | GBR (n = 10) | GAR (n = 10) |
| 50% 1RM | 21.2 ± 1.2 | 29.2 ± 5.1 *** | 17.7 ± 2.0 | 29.0 ± 7.1 *** |
| 60% 1RM | 16.9 ± 1.2 | 21.7 ± 1.5 *** | 12.5 ± 1.6 | 19.9 ± 4.5 *** |
| 70 % 1RM | 10.7 ± 1.3 | 13.9 ± 2.0 *** | 7.2 ± 1.1 | 12.0 ± 2.9 *** |
| 80% 1RM | 6.6 ± 1.0 | 8.8 ± 1.0 *** | 4.8 ± 0.6 | 7.1 ± 1.3 *** |
| 32% superior | 59% superior | |||
Tabla 8. Distribution of the subjects in two groups based on the repetitions performed before each percentage of the RM in the bench press and squat exercises (Rodríguez-Rosell et al., 2019).
- GBR: half of the subjects who performed the lowest number of repetitions per series
- GAR: half of the subjects who performed the highest number of repetitions per series
- PB: Bench press; Squat: Full squat;
- Differences between groups: *** p ˂ 0.001
Once the subjects were grouped, it was verified what the speed loss had been with the load that, prior to the tests, could be moved at 1 m·s–¹. This loss of speed is the variable that would serve as an indicator of the degree of fatigue reached by each subject. The results are presented in Figure 16.3.
No significant differences were observed between the groups. This analysis, really compromised for the authors of the study, confirmed the importance of controlling the loss of speed in the series as an indicator of the degree of fatigue generated in the series or set of series of a training session, despite the fact that the number of repetitions performed by each subject was different, as well as the use of the load that can be moved at 1 m s-¹ as a criterion to assess and validate the degree of fatigue generated by training.
If what is programmed for each training session is a certain degree of effort or fatigue, and this seems hardly debatable, the probably most reasonable and precise way of knowing the degree of effort that is programmed and performed is by controlling the loss of speed in the series at a certain speed of the first repetition in the series itself. Knowing that, in turn, this speed is the best indicator of what is the relative intensity or real percentage of the RM with which the training of an exercise begins.
The probably most reasonable and precise way of knowing the degree of effort that is programmed and performed is by controlling the loss of speed in the series at a certain speed of the first repetition in the series itself.
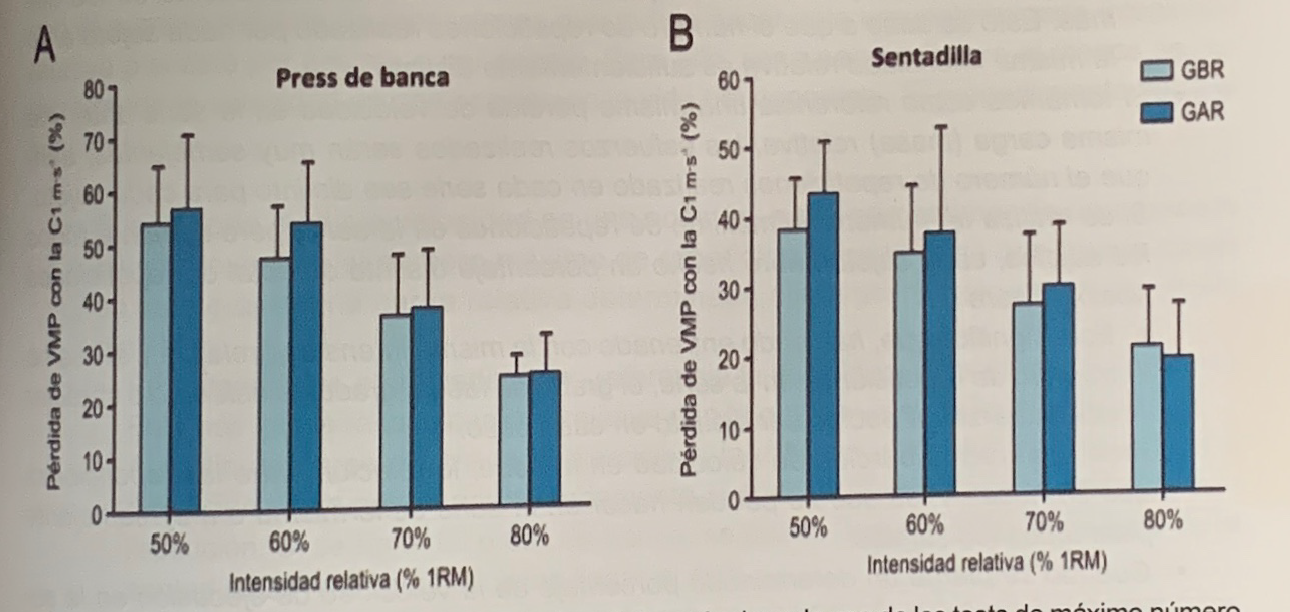
Figure 13. Loss of VMP with the load 1 m s–¹ after each of the tests of the maximum number of repetitions possible in each of the groups in fusion of the number of repetitions performed (GBR vs GAR) for the exercise bench press (A) and full squat (B) (Rodríguez-Rosell et al., 2019).
Therefore, if we know the speed of the first repetition, we know the relative intensity (percentage of the RM) (González-Badillo & Sánchez-Medina, 2010), and therefore the degree of effort that said first repetition represents. In addition, if we measure the loss of speed during the series, we will have the degree of fatigue that has been generated in the series (Sánchez-Medina & González-Badillo, 2011; Rodríguez-Rosell et al., 2019).
And since given the same percentage of loss of speed in the series, the percentage of repetitions performed is the same or very similar for all subjects, regardless of the relative intensity and the number of repetitions that can be done in the series (González-Badillo et al., 2017; Rodríguez-Rosell et al., 2019), if we control the speed of the first repetition and the loss of speed in the series, we will have very precise information on the degree of fatigue (character of the effort, degree of of effort) that has been generated to the subject and, in addition, that this degree of fatigue is very similar for all the subjects with the same relative intensity and the same loss of speed in the series. That is, it is the loss of velocity in the set that equals the effort, not the number of repetitions performed in the set at the same relative intensity.
If we control the speed of the first repetition and the loss of speed in the series, we will have very precise information on the degree of fatigue (character of the effort).
Therefore, the control of the training load, quantified through the degree of effort or character of the effort made, is achieved in the most precise way if we control the speed of the first repetition in the series and the loss of speed in the series. .
From the above, the following can be concluded:
- Being able to do the same number of repetitions in a series before a determined absolute load (individual load for each subject) does not mean that you are training with the same percentage of the RM. Therefore, performing the same number of repetitions at the same relative load means that most athletes make a different effort than others. This is because the number of repetitions performed by each subject at the same relative intensity is quite different.
- If the same loss of speed in the series is taken as a reference before the same relative load (mass), the efforts made will be very similar, although the number of repetitions carried out in each series is different for each subject.
- If a non-maximum number of repetitions is performed in the series, but common to all the subjects, each subject will have done a different percentage of the total number of repetitions possible for him. This means that, having trained with the same relative intensity and the same number of repetitions in the series, the degree of fatigue, degree of effort or character of the effort could have been different in each case.
- Given the same loss of speed in the series, the relationship between the repetitions that are done and those that can be done in the series is the same or very similar for all subjects.
- When a certain percentage of the speed of execution in the series is lost, the same percentage of the possible repetitions in the series has been performed at intensities between 50 and 70% of the RM in the bench press. If the intensities are 75, 80 and 85%, given the same percentage of repetitions performed, the speed losses will be 2.5, 5 and 10% less, respectively. If it is the squat exercise, given the same percentage of speed loss in the series, from 50 to 60% and probably 65%, the percentage of repetitions performed is the same, and increases from 70% of the RM. It seems that the increase in the percentage of repetitions performed for the same loss of speed in the series occurs when the number of repetitions possible in the series is approximately 10.
- If we control the speed of the first repetition and the loss of speed in the series, we will have very precise information on the degree of fatigue (character of the effort). that has been generated to the subject and, furthermore, that this degree of fatigue is very similar for everyone with the same relative intensity and the same loss of speed in the series. That is, it is the loss of velocity in the set that equalizes the effort, not the number of repetitions performed in the set with the same relative load.
- Therefore, the loss of speed in the series equalizes the efforts, the degree of fatigue generated, even if two people have done a different number of repetitions before the same relative load:
- This means that what would best express the degree of effort, and what should be programmed, is the speed of the first repetition and the loss of speed in the series, not the number of repetitions to perform in the series under a load (relative to or absolute)
- If speed can be measured, repeats should never be programmed into the set.
WHAT TO DO WHEN YOU CANNOT ALWAYS MEASURE SPEED
One of the immediate concerns for anyone who reads or hears about the benefits of speed control is the impossibility of measuring it. The solution, naturally, is to find a measurement system that allows this information to be obtained permanently, but if this cannot be achieved, we can offer an alternative that, in part, solves the problem of knowing if a subject can be located in the average in relation to the maximum number of repetitions you can do at a certain relative intensity or if it is above or below. For this, it would be necessary to be able to measure speed at least once in sporting life. The procedure would be the following:
- If speed can be measured on one occasion, it is possible to estimate in a very approximate way the number of repetitions in the series that a subject can do at a given relative load without reaching muscular failure (XRM or nRM).
- First, the speed of the first repetition would be taken as a reference. This would indicate the relative intensity with which the test is to be carried out.
- The exercise would then be performed at the maximum speed possible in each repetition until approximately 40-50% of the speed of the first repetition was lost. If it is about the bench press, you can reach 50%, if it is about the squat it is more than enough to reach 40%.
- The evolution of the number of repetitions performed before 2-3 percentages of speed loss in the series is analyzed. For example, 15, 20, 25, 30%…
- The necessary calculation is made to estimate the number of possible repetitions in the series based on the number of repetitions performed with each percentage of speed loss. For this, the tables that we have exposed in this article are consulted.
- The results obtained with each percentage of speed loss are contrasted, and it is verified if in all cases the result is very similar. It should be, unless the subject did not perform the test correctly.
- Once the result is obtained, we will proceed to verify where the subject is located. To do this, five groups could be made: those who are within the measure, those who are 10-15% above or below the measure, and those who are 25-30% or more above or below the measure. half.
- Once the subjects have been located, the number of repetitions programmed at a relative intensity (assumed to be at least close to what it is intended to be) will be different for each one depending on their location within the groups to which they belong.
- Once the subject is located, it is very likely that this will not change throughout his sporting life, so it is information obtained in one day that is useful for a lifetime.
- All this procedure could be done with more than one intensity, at least two, on different days, for example, with 50 and 70% or 60% and 80%. This would help confirm the results. The two tests could be done in a week, 3-4 days apart.